


Data Science is indeed a hot topic for last few years since it was mentioned as the sexiest job of 21st Century. Indeed Data Science is awesome and has a lot of scope, I will compare this scenario to what the computer industry was in 1900s and early 2000s, it is similar for the Data Science industry right now.
A lot of people from different fields are switching into Analytics and Data Science field, a lot fresh graduates are trying to get a job in this field but the companies expects the hires should have prior experience in this field or they should have worked on some similar projects.
I wanted to write this article to help such people using my past experience. This article contains the use of almost every important tools and knowledge used in the Data Analytics project in the industry except for the use of Microsoft Excel, which I believe is a very crucial skill if you want to work in the Analytics field.
The steps of Data Science are as follows in the mentioned order:
1. Problem Statement
2. Data Collection
3. Data Cleaning
4. Data Analysis and Visualization
5. Modelling (Machine Learning Part)
I wanted to name this article as Data Science End to End Project. But I thought that will not be a good idea as I will not be discussing the modeling part in this article. Hence I named this as Data Analytics End to End Project as it covers almost every part of a Data Analysis process from Data Collection to Data Analysis.
Here are the steps we will follow in this article:
1. We will come up with a Problem Statement.
2. We will collect the data using an API which will run on a cronjob every hour on an EC2 virtual machine and store the data collected on AWS RDS.
3. Then we will see how to clean this data.
4. Finally using Tableau, we will try to find some insights from this data.
This will be an end to end project which will start from a problem statement to coming out with the insight. You can follow these steps to replicate the same project or maybe come up with your own problem statement, find the API to get data for that problem to collect the data (the source of data collection might be different. You can use web scraping or survey or any other source), create a database either on cloud or local system and finally use this data to find the insights using Python or Tableau.
Step 1: Problem Statement
I started this project in the month of September 2019. I wanted to do a project where I will cover every part of the Data Analysis process. When you work in organizations, you don’t really get to work on end to end project.
The problem statement might be coming from an MBA guy or senior management in the company. The data collection part will be taken care of by a different team. There might be a different team for Data Cleaning Process. Finally, a different team for using this cleaned data to do data visualization or analysis.
But if you are in a startup, the scenario might be different. You will be responsible for multiple roles in this process. But if you know the A to Z of this process and have the hand-on experience, it will be beneficial. A startup would like to hire you as you will be able to manage multiple roles. A big organization would be happy to hire you, as they will be able to use you on multiple roles as per the client’s requirement.
Coming back to the project which I started in September 2019. The hot topic in India around the Month of October/November is Pollution. In late September and October each year, farmers mainly in Punjab and Haryana burn an estimated 35 million tons of crop waste from their paddy fields after harvesting as a low-cost straw-disposal practice to reduce the turnaround time between harvesting and sowing for the second (winter) crop. Also, during this period festivals like Dussehra and Diwali are celebrated in India. During these festivals, a lot of crackers are burnt which also effects the pollution level. In cities like Delhi, the PM 2.5 level goes above 999 which is a very serious issue. I wanted to understand the effect of different times and events on the pollution level in different parts of India.
So, in short, my problem statement was:
To understand the effect of different times and events on the pollution level in different parts of India.
Step 2: Data Collection
There are a lot ways to collect the data like:
- Through API – Mostly this is a cleaned form of data and does not require further cleaning.
- Web Scraping – Most of the time you will need to spend a good amount of time cleaning such data.
- Transactional Data
- Online Marketing Analytics Data (Customer Journey, etc.)
- Surveys and Interviews, etc.. etc..
The best way to get the data for Data Analysis or Visualization according to me would be to use an API as mostly they are clean. But if you are an offline or online store like Walmart or Amazon, you will be having huge transactional data. A good DBA would make sure to keep this data in the cleaned format, so an Analyst will only have to query the data according to the requirement from this huge pile of data and do the analysis. Even the Online Marketing Analytics or Survey Data will be in a cleaned format, but methods like Web Scraping can consume a lot of time in Data Cleaning. You can write all the cleaning codes in the script only so that the final scraped output you get is clean and ready to use. The biggest pain is cleaning the text data, I have worked on it can be really frustrating sometimes.
So for this article, I have used an API provided by the Government Of India on their website https://data.gov.in/, I found this API where they were providing Air Pollution data for about 1200 places across different cities and states in India on an hourly basis. Different metrics like PM2.5, PM10, NO2, NH3, SO2, CO, and Ozone’s Maximum, Minimum, and Average values were collected.
This data was provided on an hourly basis, so if you hit this API at 3 PM, it will provide you the data collected till 2 PM for the 1200 places, but if you hit this API at 5 PM you will get the data for 4 PM. Hence you cannot get the past data from this API, so you have to create a DB to append the new data every hour.
2a. Collecting the Data in Database or Google Sheets
There are two ways you can collect this data. Either you can use Google Sheets as your Database and keep on appending the new data or you can create a Database using AWS RDS. Initially I started with using Google Sheets as it is free, but Since I was planning to collect the Air Pollution data for about an year, using Google Sheets was not a good idea. I was collecting about 900K rows of data every month.
How To Collect Data Using API In Python
I would not bother writing this article again as I have already explained this in one my article, please check this out:
Tutorial: Fetching Data Through API in Python
How To Read And Write Data To Google Sheets Using Python
I have also written a detailed article for the same, Please check this out:
Tutorial: Reading And Writing Data in Google Sheets Using Python
I will suggest if your data is not going to be too huge and somewhere up to 500K to 800K rows of data, then you can definitely use Google Sheets. It is free and you can continue to collect the data as long as you want.
How To Create a Database on AWS RDS and Connect To Workbench
In order to go to the next step of writing a Python Script to collect the data from the API, convert that to Data frame and store append that data into a database, we will need to create a database first on AWS RDS. If you plan on using google sheets to collect your data, you can check out the article I have shared above in order to learn how to store data into google sheets using Python.
In order to create a Database on AWS RDS, you will need to Sign Up for AWS, and if you are using AWS for the first time, you can use a lot of services on AWS for free for a year. That is really amazing, In fact, the data I collected for about a year, it was during the free access time I had on my account.
Check out this video made by me in order to see how you can create a database on RDS and connect that to Workbench on your system.
How To Collect Data Using API and Store That In a Database On AWS RDS
If you decide to use create a MySQL Database on AWS RDS and want to store the data there, you should check out this code:
#Import all required packages
import requests
import pandas as pd
import io
import pygsheets
import datetime as dt
from datetime import timedelta
from sqlalchemy import create_engine

urlData =requests.get("https://api.data.gov.in/resource/use-your-key").content

#Converting the data to pandas dataframe.
rawData = pd.read_csv(io.StringIO(urlData.decode('utf-8')))
#Replace with proper name.
rawData = rawData.replace(to_replace ="Andhra_Pradesh", value ="Andhra Pradesh")
rawData = rawData.replace(to_replace ="West_Bengal", value ="West Bengal")
rawData = rawData.replace(to_replace ="Uttar_Pradesh", value ="Uttar Pradesh")

#Append blank row in the end of the dataframe.
rawData = rawData.append(pd.Series(), ignore_index=True)
now = dt.datetime.utcnow()+timedelta(hours=4, minutes=30)
now = now.strftime('%d-%m-%Y %H:00:00')
rawData['Measure_time'] = now

# changing columns using .columns()
rawData.columns = ['Id', 'Country', 'State', 'City',
                'Station', 'Last Update', 'Pollution ID',
'Pollutant Min', 'Pollutant Max', 'Pollutant Avg', 'Pollutant Unit', 'Measure_Time']

#Connection To Your Online Database begins
engine = create_engine("mysql://user:password@server"
.format(user = "your username",
pw = "your password",
db="your database name"))

#Insert whole DF into MySQL
df.to_sql('hourly_air_pollution', con=engine, if_exists='append', index=False)
2b. Putting The Python Script On a Virtual Machine on AWS EC2
Once we have our python script ready for either getting the data and putting it on a Database on AWS RDS or on Google Sheets as per our requirement and wish, we need to put this script on a cloud platform. This script needs to run every hour and putting this on a Windows Task Scheduler or on a Cronjob on our local system will not be a good idea as our local system will not be on 24*7 (most probably), so we will need to set up a Virtual Machine on Cloud. You can use any cloud platform to achieve this task, but I will show you how to do this on AWS.
I have created a video to explain this task, it will take merely 5-10 minutes if you are doing this for the first time, but if you know how to do it, it will take less than 2 minutes to set up a new Virtual Machine on EC2 and connect this via SSH to your local system.
Starting A Virtual Machine On EC2 and Connecting to Local System Via SSH Using Gitbash
Creating And Putting Your Python Script On Cronjob On AWS Machine
So till now, here is our progress:
- We have the Problem Statement ready.
- We found an API to get the data for our problem statement. In order to collect the data, we either created a Database on AWS RDS or used a Google Sheet.
- We wrote a Python code to get the data from the API and append it in the Google Sheet or the Database.
- We have put this script on AWS Machine on cronjob to make sure we are getting the data properly every hour.
Step 3: Data Cleaning
The good thing here for me is I can skip this step as I am collecting my data using an API. The data collected from the API are mostly in a cleaned format and you don’t have to spend time cleaning them. In my case, this is what my data looked like in the database:

As you can see in the image, this is a pretty cleaned version of the data and I can use this for Analysis and Visualization without any further changes.
But in general Data Cleaning is a very huge topic and it can completely vary on the type of data you are dealing with. You might have to do the cleaning while collecting the data, this type of cleaning will be done in the code, like in my Python code where I was collecting the Air Pollution data, I had to do a bit of Cleaning. I wanted to use this Data in Tableau for Data Visualization, but the name of a few states was not coming in the correct format, because of this Tableau will not understand the names of the states and hence will not be plot the locations correctly on India’s Map. Eg: Andhra Pradesh was coming as Andhra_Pradesh so on, so I wrote a small piece of code for this:
#Replace with proper name.
rawData = rawData.replace(to_replace ="Andhra_Pradesh", value ="Andhra Pradesh")
rawData = rawData.replace(to_replace ="West_Bengal", value ="West Bengal")
rawData = rawData.replace(to_replace ="Uttar_Pradesh", value ="Uttar Pradesh")
Similarly, you might have to do the cleaning according to your data in the code itself.
If it is not possible to do the cleaning of the data in the source code, you might have to do this afterwards at the time of querying the data from the database.
I will not deep dive into data cleaning at the moment because it is a very vast topic but I would provide you with links to some good articles which I was able to checkout related to Data Cleaning, I am sure it will be useful:
1. Data Cleaning Techniques: Learn Simple & Effective Ways To Clean Data
2. The Ultimate Guide to Data Cleaning (Medium)
3. Data Cleaning (Elite Data Science)
4. 5 Best Practices For Data Cleaning
5. Data Cleaning Techniques
Result: The Cleaned Data For Analysis
After putting in all this effort, you get the cleaned version of your data for your analysis. Voila!!!
I started collecting this data on 14th Oct 2019, but for a few days the data was not collected properly and there were few hours of data missing. I continued this collection of the data till September end 2020. In this period I collected a little over 10 million rows of data. I have published that data on the Kaggle Dataset for people to use and do the analysis.
This dataset in CSV format was taking up around 1.2 GB, but I also created a .hyper extract (the Tableau data format) which was only about 122 MB files. I have uploaded the CSV and the Hyper file on the Kaggle Dataset website and you can download the same from here:
https://www.kaggle.com/prateekcoder/ind-hourly-air-pollution-data-oct2019-to-sept2020
This dataset can be used to analyze a lot of things like:
- How does the time period burning of crops by Haryana and Punjab Farmers affect air pollution?
- Affect of festivals like Diwali and Dussehra on the air pollution level.
- Is the pollution level less in winter months like January and February compared to November and December?
- What was the effect of the Pandemic on the air pollution levels across India? ( This decreased drastically, we all know that but the detailed data will give you the exact picture.)
Step 4: Data Analysis
Now we have the cleaned version of the data, I have provide the link to the CSV format and the Hyper format of the data. Now I will suggest you guys use this data to extract some insight from the data using the tools of your choice, it can be Excel, Python, Tableau or any other tool. Being a Data Analyst the end goal is to solve the business problem, tools are just a medium to reach the destination.
For reference, let me show you a quick tableau Dashboard I built:
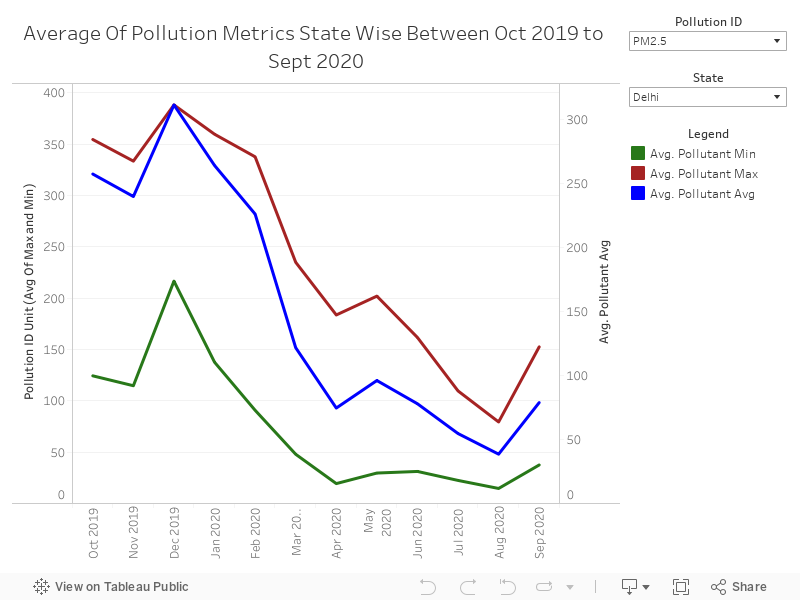
Now I built this Dashboard in 4-5 minutes and few quick insights that I can derive from this visual are:
- The average PM 2.5 level in Delhi dropped from 388 in December 2020 to 74.6 in April 2020.
- After major Unlocks in Delhi in August, the PM 2.5 level can be seen increasing significantly.
- There was no major effect of lockdown on pollutant metric Ozone as the highest average value can be seen in May 2020. So we will need to dig deeper to find the variables having a good correlation with Ozone pollutant id.
There are other information as well that can be drawn from the visual and much better and informative Dashboard can be built using this data. I will leave that for you guys to brainstorm and come up with something better.
I hope this article helps you. If you have any further doubts you can ask me in the comments below.